统计程序运行时间
1 方法一:使用 time 函数
1 | import time |
2 方法二:
在 Jupyter 的 cell 开始处加关键字 time,统计代码段运行时间
1 | %%time |
注意:使用该方法可能影响 debug 信息输出,debug 时请注意关闭
3 方法三:
在程序行前加关键字 time,统计代码行运行时间
1 | %time 程序行 |
4 方法四:
使用 cProfile 模块生成脚本执行的统计信息文件(运行时间,调用次数),使用 pstats 格式化统计信息,并根据需要做排序分析处理
4.1.1 示例
1 | import cProfile |
输出:
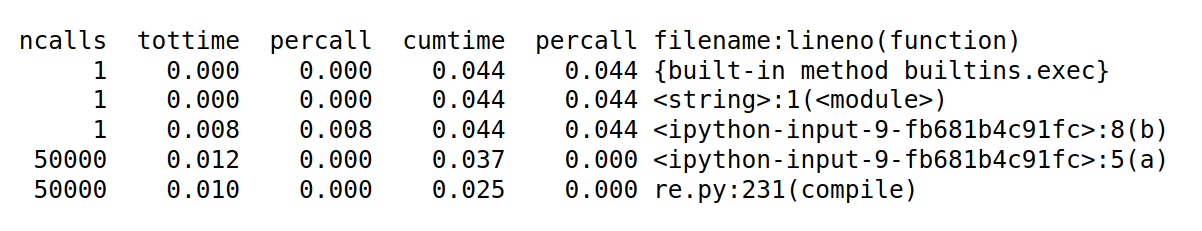
显示关键字
ncalls:调用次数
tottime:花费的总时间(不包括调用子函数的时间)
percall:tottime 除以 ncalls 的商
cumtime:函数及其所有子函数累积时间
percall:是 cumtime 除以 ncalls 的商
filename:lineno(function):函数名和位置
排序参数
| 有效字符串参数 | 有效枚举参数 | 含义 |
|---|---|---|
| calls | SortKey.CALLS | 调用次数 |
'cumulative' |
SortKey.CUMULATIVE | 累积时间 |
'cumtime'N/A |
累积时间 | |
'file'N/A |
文件名 | |
'filename'SortKey.FILENAME |
文件名 | |
'module' |
N/A | 文件名 |
'ncalls' |
N/A | 调用次数 |
'pcalls' |
SortKey.PCALLS | 原始调用计数 |
'line'SortKey.LINE |
行号 | |
'name' |
SortKey.NAME | 函数名称 |
'nfl' |
SortKey.NFL | 名称/文件/行 |
'stdname' |
SortKey.STDNAME | 标准名称 |
'time' |
SortKey.TIME | 内部时间 |
'tottime' |
N/A | 内部时间 |
5 注意
- 函数时间统计是包含的关系
6 参考
All articles in this blog are licensed under CC BY-NC-SA 4.0 unless stating additionally.